Image

As noted in the Preamble of this report, human capital development is about supporting countries to create lifelong learning systems which will provide opportunities and incentives for people to develop their knowledge, skills, competences and attitudes throughout their lives, helping them to find employment, realise their potential, and contribute to prosperous, innovative and inclusive societies. The value of human capital for individuals, economies and societies depends on how well it is developed, and on the extent to which it is then available and used.
In Lebanon, human capital is both the country's main asset and a challenge for its socio-economic development. Some of the key indicators available on human capital, and those seen in the national report outcomes, suggest that there are many challenges at different levels and stages. The availability and utilisation of human capital is affected by many factors, amongst which sectarian governance, political conflicts and upheavals, demographic transformation, and lack of data are the most common.
More specifically, human capital development is hampered by low levels of job creation, skills mismatch, weak public employment services, and limited access to LLL and adult learning, as well as the inadequate capacity of public authorities for undertaking reform.
Table 1. Selected Indicators of Human Capital, Lebanon
|
Indicator |
Year |
Value |
|
(1) Population structure (%) |
||
|
0–24 |
2015 |
45.7 |
|
25–64 |
48.0 |
|
|
65+ |
6.3 |
|
|
0–24 |
2025 |
37.7 |
|
25–64 |
52.9 |
|
|
65+ |
9.4 |
|
|
(2) Average years of schooling |
2018 |
NA (8.7 in 2017) |
|
(3) Expected years of schooling |
2018 |
11.3 (12.5 in 2017) |
|
(4) Learning-adjusted years of schooling |
2017 |
6.8 |
|
(5) Adult literacy |
2018e |
95.1 |
|
(6) Global Innovation Index Rank (x/126) |
2019 |
88 |
|
(7) Global Competitiveness Index Rank (x/137) |
2019 |
88 |
|
(8) Digital Readiness Index Rank (x/118) |
2019 |
na |
|
(9) Networked Readiness Index Rank (x/139) |
2016 |
88 |
|
(10) occupational mismatch index |
2016 |
na |
Sources: (1) UN Population Division, World Population Prospects 2019 revision; (2) UNESCO UIS database; (3) and (4) World Bank HCI; (5) UNESCO, UIS database; (6) WEF, Global Innovation Index, 2019; (7) WEF, Global Competitiveness Index 4.0, 2019; (8) Cisco, Country Digital Readiness, 2019; (9) WEF, Networked Readiness Index, 2016; (10) ETF, Skills mismatch in ETF partner countries, 2016.
The population structure of Lebanese residents shows a clear trend towards an aging population, as the age group 0–24 is set to decrease from 45.7% to 37.7% of the population, and the 65+ group increase from 6.3% to 9.4% between 2015 and 2025. This will have an obvious impact on the education and labour market sectors. The country's low ranking in the global innovation, competitiveness and networked readiness indexes are also linked with human capital development and use in Lebanon, as we will see in the analysis below and in Chapter 3. Other international human capital indicators, such as average years of schooling, digital readiness index and occupational mismatch index, are not available for Lebanon.
The following sections provide an analysis of the main human capital development challenges that hamper the country's socio-economic development and need to be addressed as a priority.
The Lebanese economy has faced severe challenges throughout the last decade: GDP growth plummeted to 0.2% in 2018[27] World Bank and OECD National Accounts data.
, while the precarious economic context of the past decade has been exacerbated by a high and growing public debt (an average debt-to-GDP ratio of 149% in 2010–2017[28] McKinsey & Company, 'Lebanon Economic Vision' Report, 2018.
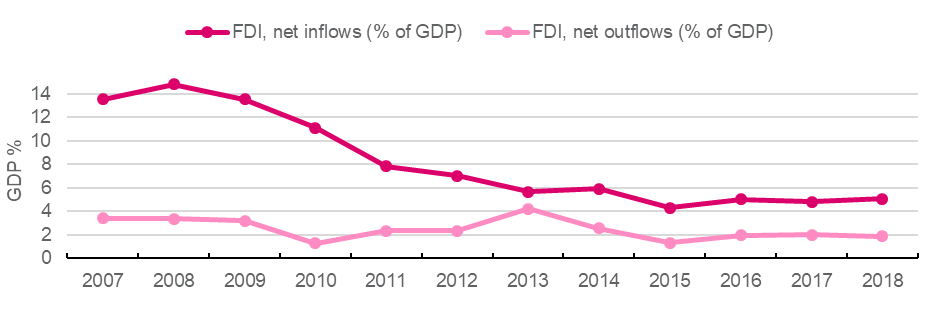
, among the highest in the world), as well as a worsening international business environment, characterised by a significant decrease in foreign direct investment inflows (down from 13.3% of GDP in 2007–2010 to a mere 4.8% in 2015–2018)[29] International Monetary Fund, IMF Balance of Payment Database.
.
Figure 6: Foreign Direct Investment: Inflows vs. Outflows
Source: International Monetary Fund, IMF Balance of Payments Statistics Database.
In addition, the Lebanese economy has traditionally focused on non-productive service sub-sectors (in particular real estate and banking), whereas the contribution of manufacturing to GDP in 2018 was merely 7.8% (only 15.6% of which was driven by medium- and high-tech industries[30] UNIDO, Competitive Industrial Performance (CIP) database, 2019.
). The McKinsey Report (2018) estimated that productive sectors contributed 16% of the country's GDP in 2016, as opposed to 20% in Jordan and 32% in Morocco. The result of the current stagnating economic context is a limited expansion of enterprises and job creation, with the domestic labour market unable to absorb the huge number of existing and new jobseekers, particularly women and young people. Additionally, the informal sector is substantial: according to CAS (2019), the overall share of employees who have make no social security contributions is 55%, while according to McKinsey (2018), the figure is as high as 92% for agricultural workers.
The horizontal and vertical skills mismatch is reported as very important due to the structure of the country's enterprises (around 73% are classified as micro, with fewer than 10 employees[31] Lebanon SME Strategy: a roadmap to 2020, Ministry of Economy and Trade, November 2014.
) and their limited capacity to anticipate skills needs. This mismatch is exacerbated by weak public employment services and lack of career guidance and counselling. Competition for jobs from Syrian refugees who accept lower wages and no social benefits has deepened the issue of mismatch and undermined the employability of Lebanese youth: 32% of those working in informal employment are university graduates (McKinsey, 2018).
Other fundamental problems pertaining to unemployment are the length of time spent searching for jobs by those who want to enter the labour market for the first time and the challenges related to permanent work and fair wages. The average duration of unemployment is estimated to be close to one year, and the youth (15–24) unemployment rate in 2018 was more than double the national (15+) average, namely 23.3% vs. 11.4% (CAS, 2019). (According to a previous estimate, in 2017 the unemployment rates were even larger: with 25% the national average; 37% for young people aged under 35, and 18% for women[32] Arab Weekly Digest, 'Interview with the Minister of Labour', Beirut, August 2017.
.)
Figure 7: Unemployment Rates by Education Level, 2018–2019

Source: CAS (2019)
Moreover, the existence of a skills mismatch issue for young jobseekers is highlighted by the fact that the higher their educational attainment, the higher their chances of being unemployed, with youth unemployment rates for university graduates as high as 35.7%, compared to 18.0% for young people with only primary education (CAS, 2019). VET graduates in the age-range 15–24 fall within the secondary education level, which shows an unemployment rate of more than 25%. Longer transition periods for the better educated may also be an indication of their higher expectations regarding their first job or that they can afford to wait because they come from better-off families.
This paradox, consisting of a lack of a mid-range technical workforce combined with a high level of unemployment, can be explained by many factors, ranging from the reluctance of graduates to accept inferior quality and low-wage jobs to issues related to the unattractiveness of the VET system (with its generally perceived low social value and poor quality of provision), the scarcity of data regarding work in general and skills needs in particular, weak inter-institutional cooperation and the reluctance of employers to be involved in the policy cycle due to a lack of trust in public services.
The above issues, paired with an absence of skills anticipation mechanisms and the lack of continuous training initiatives and deficient LLL policy in general, make the risk of a lack of synchronisation between skills and future changes in the job market very high.
Lebanon suffers from a serious lack of data at all levels. Labour market information and figures are scarce, incomplete, outdated and in some cases contradictory. The last official census was in 1932. Other unofficial censuses have been conducted, for instance in 1956, but the results were not published to preserve the fragile political consensus among the country's different religious groups.
The preliminary results of the first Labour Force and Households' Living Conditions Survey launched by the Central Administration of Statistics (CAS) were published at the end of 2019, just as this report was being finalised. CAS made the preliminary key findings from the LFHLCS available for inclusion in this assessment.
Currently, Lebanon has no LMIS, and the National Employment Office (NEO) still lacks the full financial and human resources capacity to collect data on jobseekers, vacancies and labour market absorption, or even to register jobseekers. A systematic data collection process to analyse labour market trends and track its absorption capacity would allow a better matching of employers' demands with the supply of graduates, thereby making it possible to effectively address skills shortages and mismatch, to guide VET curricula according to labour market needs and to ease the school- and work-to-work transition.
Similarly, the shortage and inaccuracy of data in the VET sector present a barrier to policy planning and the implementation and monitoring of policies and measures. The Torino Process national report underlines the absence of skills anticipation tools, national tracer studies or any other ways of monitoring graduates' placement in work or business creation, not to mention the lack of even basic data giving official statistics for enrolment, success rates, etc.
This, combined with the weak institutional, manpower and financial capacities of VET authorities to lead structural reforms, the highly centralised governance setting and the limited involvement of employers in the policy cycle, make it difficult to evaluate the skills mismatch in Lebanon and to anticipate and respond to its labour market needs. Even more importantly, this weak institutional capacity limits the appropriation and ownership of the national and donor-led reform initiatives.
Lebanon's total population has increased by 45% throughout the last decade, rising from 4.7 million in 2008 to over 6.8 million in 2018. The influx of an estimated 1.5 million Syrian refugees since 2011, in addition to the presence of Palestinian refugees caught in a protracted displacement situation (487 270 according to the latest UNRWA estimate in 2019[33] UN Department of Economic and Social Affairs, Population Division (2019) and UNRWA (2019).
), has placed a major strain on public finances, infrastructure and service delivery.
Figure 8: Population, Immigrant Stock and Refugees Inflow
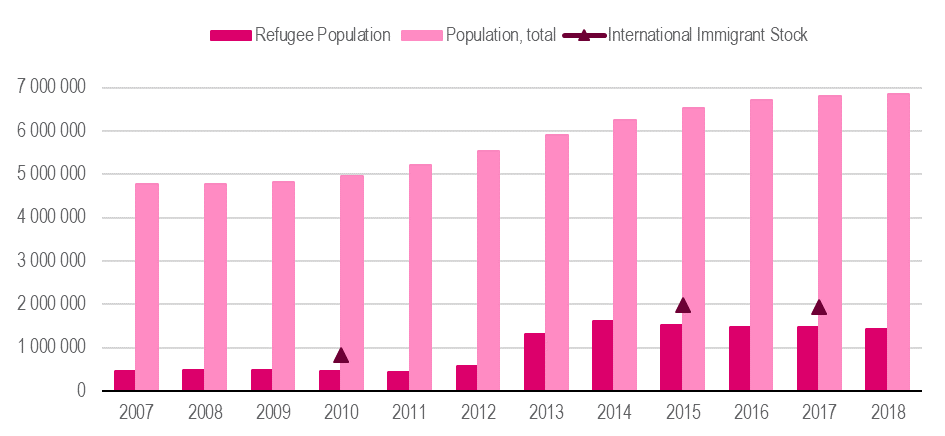
Sources: UN Population Division (2019), UNHCR (2018), UNRWA (2019).
On the other hand, the country has experienced high rates of emigration among the Lebanese labour force (generally young and educated people). There have been frequent attempts to assess the total number of people leaving the country, though such estimates are often politically driven (according to the UN Population Division, in 2019 the total number of Lebanese emigrants was 844 158, whereas the broader Lebanese diaspora is estimated at between four and 13 million) (Jaulin, 2006). The reasons behind emigration are linked to family, socio-political and economic factors, and there is a generally positive attitude (in society, the government and among politicians) towards Lebanese labour emigration because of the large amount of inward remittances it creates. The World Bank estimated the value of inward remittances at USD 7,313 million in 2019, representing 12.5% of GDP – the second highest percentage in the region after the West Bank and Gaza (World Bank, 2019)[34] The World Bank Migration and Remittances Data, Oct. 2019.
.
While it has been suggested that the influx of refugees has increased the flow of outward emigration, there is a lack of evidence concerning the exact relationship between the two phenomena. Likewise, the majority of refugees are young people and children with very low educational attainment, whereas 50% of the Lebanese emigrants have secondary-level education or higher (25% have tertiary credentials) (OECD, 2015).
Figure 9: Immigrant Stock Age Structure, 2017
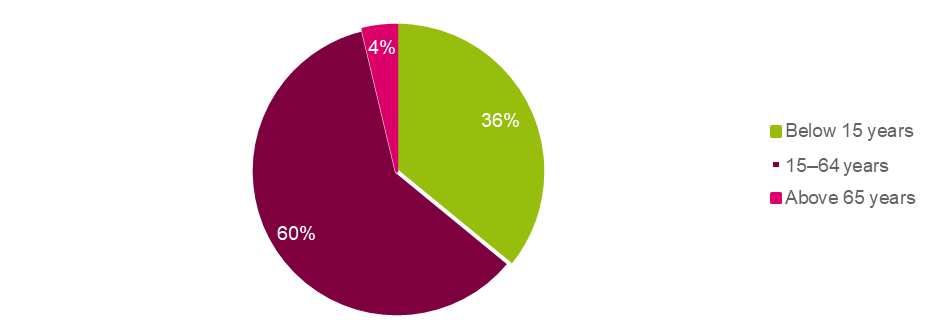
Source: UN Population Division Database.
Figure 10: Lebanese Population Age Structure, 2017–2018
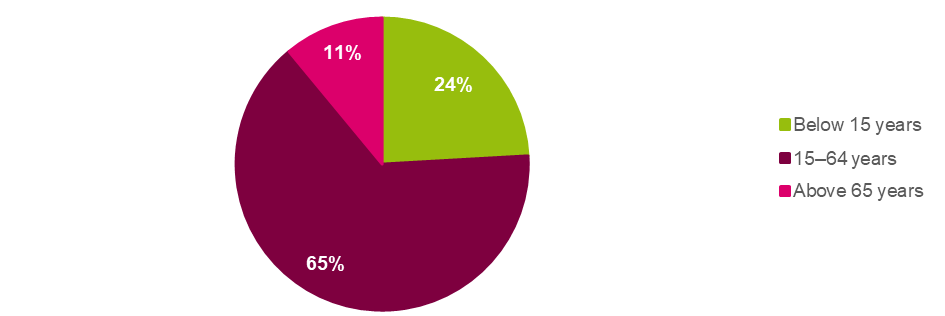
Source: CAS (2019).
These demographic transformations have a direct impact on employment and education in the country. Indeed, given the relatively low education levels of immigrants and refugees and the significant legal restrictions on the sectors and occupations where they are authorised to find employment, most refugees are forced to work irregularly in the informal economy, where they accept much lower wages than Lebanese citizens. On the education and training side, the international community provides support to expand the country's infrastructure and resources and accommodate some of the school-age refugees.
In order to help address global challenges such as poverty, inequality, climate change, the environment and prosperity and peace, starting from 2016, Lebanon has been strengthening its engagement with the Sustainable Development Agenda 2030[35] In September 2015, 193 Member States of the United Nations adopted the 2030 Agenda for Sustainable Development. They committed to a set of goals (SDGs) that seek to eradicate all types of poverty and achieve a more sustainable world, addressing challenges ranging from governance to health, from women's empowerment to environmental sustainability. The SDGs build on the previous Millennium Development Goals (MDGs) and set out a vision for what world should look like in 2030.
. Lebanon presented its first Voluntary National Review of the 2030 Agenda for Sustainable Development and Sustainable Development Goals (SDGs) in 2018. Among the targets set, the country has achieved at least seven, showing notable progress in education and health, as well as a satisfactory performance in gender equality[36] Lebanon Voluntary National Review of Sustainable Development Goals, 2018.
. Overall, the government has taken major steps towards the implementation of the SDGs and has sought to send out a positive message about its commitment and determination to implement the 2030 Agenda.
Figure 11: Number of Lebanese Organisations that are Reporting on the SDGs
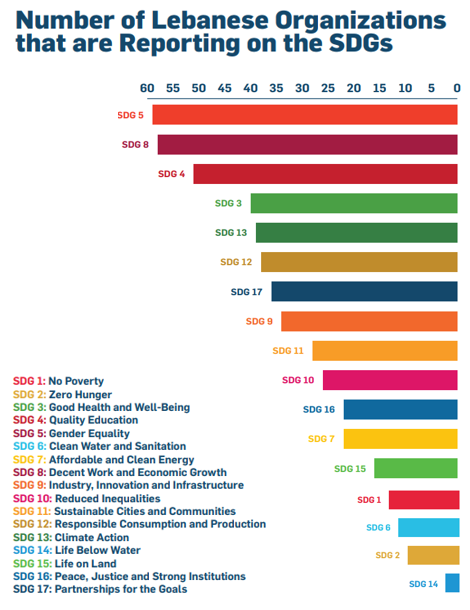
Source: Global Compact Network Lebanon (2019).
However, Lebanon is facing significant development challenges, and its solidarity with global efforts to create a better environment for all have come at a high cost. The already-high poverty rates have worsened with the prolonged Syrian crisis, which has limited the resources available for public services, infrastructure and the social system, while the political instability in the country has had a negative impact on economic growth, marked by a decline in investors' confidence and the shutdown of traditional markets. In terms of income inequality, the Gini coefficient ranks Lebanon at 129 out of 141 countries[37] UNDP and Republic of Lebanon Ministry of Finance (2017).
, and economic exclusion is reflected in the high rates of informal employment, with poor working conditions and limited decent employment opportunities. Hence, the remaining targets, in particular those related to poverty reduction, economic development and environmental sustainability, show mixed results and are not expected to be achieved on time. Lebanon's main strength is found in its human capital, with good quality healthcare and a robust education system still regarded as the foundations of Lebanese society, despite the massive external shocks the country has suffered. The education sector displays very high literacy rates (95.1% in 2018 according to World Bank estimates[38] World Bank, World Development Indicators (WDI).
, and as high as 99.3% for young people aged 15–24[39] UNESCO Institute for Statistics (http://uis.unesco.org/).
) and primary enrolment rates (reaching 99.2% in 2018/19 for Lebanese students in the age group 5–9[40] CAS, The Labour Force and Household Living Conditions Survey (LFHLCS) 2018–2019, 18th Dec. 2019.
), together with gender parity seen in almost all education indicators (in 2015, the primary and secondary gender parity index (GPI) was 0.95, with tertiary GPI as high as 1.56[41] The GPI is calculated by dividing female by male enrolment ratios: GPI = 1 indicates perfect parity between girls and boys; a GPI of less than 1 suggests girls are more disadvantaged than boys in learning opportunities and a GPI of greater than 1 suggests that boys are more disadvantaged than girls. Source: UNESCO, UIS Database.
).
However, the National Education Plan 2010–2015, developed by MEHE to address the qualitative disparities across public-private providers and geographical regions, had to be put on hold in order to shift the focus towards the large influx of young refugees. As the education system transitions from emergency response to meeting the development challenges of a protracted crisis, a hybrid approach to support quality and equity, alongside the enrolment of both Lebanese and Syrian students, has been developed, as seen in the Education 2030 Strategy and the National Strategic Framework for TVET (2018–2022). More specifically, the latter identified and prioritised the three main VET deficits: equitable access; quality and relevance; and governance.
Overall, despite the enormous development challenges that have compounded the previously existing issues and stretched the country to its limits, Lebanon appears to be determined to mobilise the resources needed for implementing the 2030 Agenda. The main priorities have been identified as poverty eradication, upgrading public sector education, reducing unemployment (especially amongst young people), enhancing the critical infrastructures, conserving natural resources (sustainable agriculture, waste and water crisis), and addressing the impacts of the Syrian crisis on sustainable development.