Bild

As previously mentioned, human capital is an aggregate of the knowledge, skills, talents and abilities of individuals that they can use for economic, social and personal benefit. The value of human capital depends on how well it is being developed, and the extent to which it is then available and used. Table 2 presents a selection of HCD indicators, providing a basic overview of how Moldova is performing in this respect.
The country is confronted with a considerable demographic disadvantage as a result of the ageing population and emigration. At the same time, projections suggest that the problem will have a limited impact on the demographic structure of the population of working age over the coming years (Table 2, Indicator 1). However, this also means that the population-related challenges relating to human capital that the country was facing at the time of this assessment, such as workforce depletion, are likely to persist in future years.
Table 2 also shows that young people of school age spend almost four years longer in formal education than the time they are actually learning (Indicators 2 and 4), which points to problems with the effectiveness of teaching and learning. Nevertheless, Moldova ranks in the upper half of the Global Innovation and Digital Readiness indices of the World Economic Forum (WEF) (Indicators 6 and 8), which suggests that the workforce and its HCD circumstances have a potential that can be developed and leveraged to the benefit of all. At the same time, there is a considerable degree of wastage in this area. A fifth of the higher education graduates in Moldova – who are also those with the longest and thus most costly educational careers – work in occupations that are not related to the education in which the state has been investing (Indicator 9).
Table 2. Selected indicators of human capital
|
Year |
Value |
|
|
(1) Population structure (% of total) |
||
|
0 - 24 |
2015 |
29.9% |
|
25 - 64 |
2015 |
60.2% |
|
65+ |
2015 |
9.9% |
|
0 -24 |
2025* |
25.3% |
|
25 - 64 |
2025* |
59.8% |
|
65+ |
2025* |
14.9% |
|
(2) Average years of schooling |
2017 |
11.6 |
|
(3) Expected years of schooling |
2017 |
11.6 |
|
(4) Learning-adjusted years of schooling |
2017 |
8.2 |
|
(5) Adult literacy |
2015 |
99.4% |
|
(6) Global Innovation Index Rank (x/126) |
2018 |
48 |
|
(7) Global Competitiveness Index Rank (x/137) |
2017 - 18 |
88 |
|
(8) Digital Readiness Index Rank (x/118) |
2018 |
49 |
|
(9) Occupational mismatch |
||
|
% of upper-secondary graduates working in low-skilled jobs (ISCO 9) |
2016 |
14.0% |
|
% of tertiary graduates working in semi-skilled jobs (ISCO 4-9) |
2016 |
21.8% |
* Projection.
Sources: (1) UN Population Division, World Population Prospects, 2017 revision; (2) UNESCO, UIS database; (3) and (4) World Bank (2018), Human Capital Index; (5) UNESCO, UIS database; (6) WEF, Global Innovation Index, 2018; (7) WEF, Global Competitiveness Index 4.0, 2018; (8) Cisco, Country Digital Readiness, 2018; (9) ETF, skills mismatch measurement in the ETF partner countries.
The EU benchmarks complement this picture with additional detail (Figure 1). They show that the share of people with tertiary education attainment is still low by international comparison, perhaps because close to a fifth of students leave school early, twice the EU average. Those young people who remain in formal education and training will struggle with the low quality of education they receive, and over 40% of them will be classified as low achievers by the end of their compulsory schooling.
Figure 1. EU benchmarks in education and training (%)
Note: *Year of reference 2015.
Source: ETF database.
Public spending on VET as the declared key segment of HCD in Moldova has been rather high over recent years. However, some of the evidence in the national report and from external sources indicates that there are problems with the efficiency of resource allocation and the effectiveness of investment in VET, which, in turn, prevents VET from meeting stakeholder expectations.
Despite stagnating – and in some years shrinking – student demand for VET (Figure 2), spending on VET in Moldova has remained quite steady. The payrolls of public education providers are relatively stable in terms of staff numbers, and per-student expenditure has been on the increase for years now (Figure 3), making VET the costliest segment of the national education and training system. The latest increase took place in the school year 2017/18 as a result of a rise in spending on wages and scholarships[12] NRF A.2.2.
.
Figure 2. Enrolments in secondary vocational education: total number and trend, 2012/13–2017/18 (thousands)
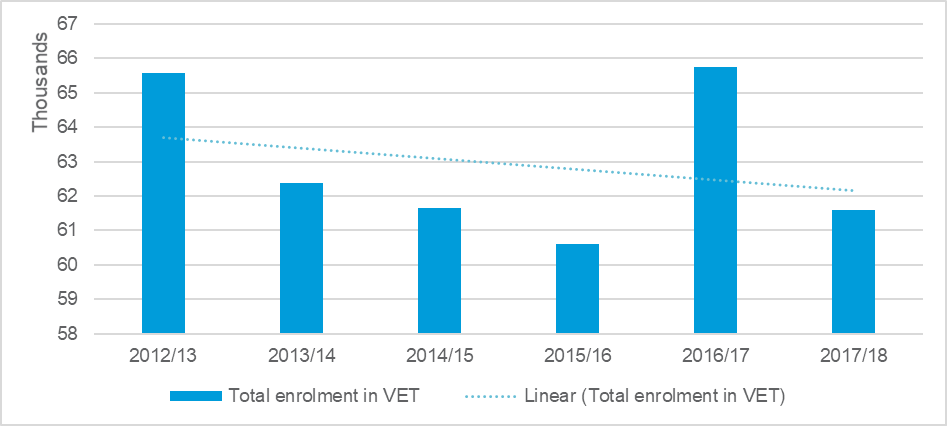
Source: ETF database.
Figure 3. Per-capita expenditure by segment of education, 2005–2015

Sources: Moldova BOOST database[13] The BOOST database is the public expenditure database of the World Bank.
and World Bank (2018).
Behind these increases, however, there is a pattern of resource allocation that may be preventing VET from unlocking the full potential of its providers to contribute to the HCD agenda of the country. The first source of concern is the low level of capital investment, which in VET is usually earmarked for significant and costly expenditure items such as equipment. In Moldova in 2015 (the latest year for which there is data), capital investment was only 2% of the total spending on VET, compared to 10% in general and 18% in pre-school education (World Bank, 2018). This is likely to jeopardise efforts towards the modernisation and improvement of the learning and teaching environment.
An additional efficiency challenge in this respect is that unlike general education providers, which since 2013 have operated on the basis of per-capita funding, VET institutions are funded on the basis of an incremental budgeting method that takes the budget from the previous year as a starting point, irrespective of real needs, enrolment levels or institutional performance. According to the national report, this arrangement is known to promote inefficiencies in the administration and use of financial resources in VET[14] NRF E.3.1.
.
The inefficiencies in resource allocation have various consequences, one of which is that spending on VET is not as effective as it could and should be. Although the financial allocations for VET are relatively high and also include sizeable donor support earmarked specifically for improvement[15] See Table 10, NRF A.3.5. The EU alone invested some EUR 30 million between 2014 and 2017 through its budget support and technical assistance programmes.
, there is evidence that providers in Moldova are struggling to deliver on expectations of quality and relevance.
There is no lack of examples demonstrating the broader challenge of rising spending on VET that does not translate into sustainable, system-wide results. One is the learning environment, which the national VET student council[16] The report uses “Council of Technical and Vocational Education and Training (TVET) Students and “VET Student Council” interchangeably.
describes as being marked by negative attitudes and substandard conditions. There is a lack of manuals, learning materials and training equipment – especially concerning occupational subjects – which, in turn, prompts teaching staff to transfer the cost of their procurement to students, a task that is beyond the means of many[17] NRF D.1.2.
.
Another instance of a gap in investment effectiveness is the professional training of teachers in VET, which the national report describes as being sporadic and of limited relevance because of resource shortages. The available funding is being allocated to cover other expenses. The problem is further exaggerated by the absence of a shared understanding of what constitutes quality in VET, as the teaching standards that are currently in place apply only to general education[18] NRF D.1.3 and NRF D.3.2.
.
Finally, the learning and training outcomes of VET are considerably below expectations. In a recent employers' survey by the National Employment Agency and the World Bank, companies reported persisting difficulties in finding workers with adequate qualifications and stated that young workers in particular lack the occupation-specific skills that their jobs require[19] NRF C.3.1.
. This seems also true for VET graduates. In 2015, 40–50% of them were economically inactive or informally employed (Figure 4).
Figure 4. Working-age population (15+ years) by employment status, form of employment and education, 2015 (%)
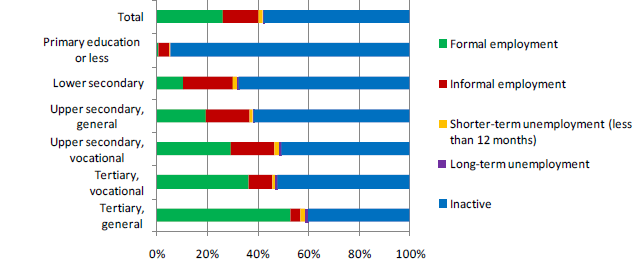
Source: World Bank, 2018.
The problem is possibly fuelled by the low quality of student intake in VET, for which, in turn, VET providers have failed to provide a remedy. According to international studies such as the Programme for International Student Assessment (PISA), close to half the student population at the end of lower secondary education underperforms in reading, mathematics and science and is below PISA proficiency level 2 (Table 3).
Table 3. Share of low achievers in education: EU and Moldova, 2009 and 2015 (%)
|
|
Moldova |
EU |
EU target |
|||
|
2009 |
2015 |
2009 |
2015 |
2020 |
||
|
Low achievers in reading (% aged 15) |
57.3 |
41.9 |
19.7 |
19.7 |
< 15 |
|
|
Low achievers - maths (% aged 15) |
60.7 |
50.3 |
22.3 |
22.2 |
< 15 |
|
|
Low achievers - science (% aged 15) |
47.3 |
42.2 |
17.8 |
20.6 |
< 15 |
|
Source: ETF and OECD PISA databases.
A skills shortage is a labour market situation in which employers are unable to recruit staff with the required skills at the usual level of pay and working conditions, either because there is an inadequate supply of workers in high-demand occupations, or because the workers available do not have the skills required by these occupations (ETF, 2012; OECD, 2017).
Unemployment rates are a viable indication of skills shortages. They are a proxy for the demand for skills associated with the occupational profiles of job-seekers. The lower the unemployment rate, the more likely it is that there is a shortage of certain skills on the labour market.
Over the past decade, unemployment in Moldova has more than halved for both genders, reaching a rate of 3% on average in 2018 (Table 4). The downward trend and the methodology used in computing the indicator, which does not take account of migration (see Section 3.2.1), might be distorting the data. Nevertheless, the national report and labour market surveys confirm that skills shortages are a major challenge for employers in Moldova (Figure 5) and, by extension, for the overarching goal of the NDS, which seeks to implement a growth model that depends on domestic human capital.
Table 4. Unemployment rate, by gender (2015–2018) (%)
|
15+ |
2015 |
2016 |
2017 |
2018 |
|
Total |
4.9 |
4.2 |
4.1 |
3.0 |
|
Male |
6.2 |
5.5 |
4.8 |
3.5 |
|
Female |
3.6 |
2.9 |
3.3 |
2.5 |
Note: The data includes all Moldovan nationals with an active address registration in the country, irrespective of their primary place of residence.
Source: ETF database.
Figure 5. Reasons why around a quarter of jobs were not filled by employers, 2016
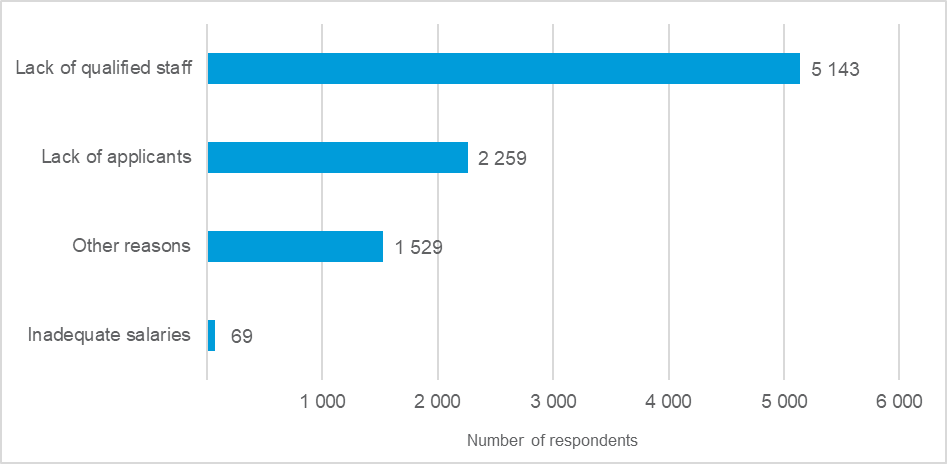
Source: Rutkowski et al. (2017).
According to information from the National Employment Agency, skills shortages are a serious impediment for businesses in Moldova, in particular the lack of occupation-specific skills and foreign language skills, as well as the low motivation and poor work ethic of prospective and current employees. Those with medium-level education struggle with analytical, problem-solving and ICT-related skills and are not willing to develop professionally, while higher-level specialists have major deficits in foreign language proficiency. The financial services, public administration and social services sectors are particularly affected by this combination of skills shortages[20] NRF B.1.2.
.
The lack of occupation-specific (hard) skills is just one indication of possible gaps in the formal education and training of prospective job-takers. Another is the apparent failure to equip individuals with a minimum set of soft skills, such as critical thinking, adaptability, problem solving and willingness to learn, which are obviously in high demand from employers. The national report acknowledges[21] NRF D.1.3.
the need to address problems in this area which, if neglected, will continue to impede the productivity, innovativeness and competitiveness of Moldovan enterprises.
Eastern Europe is on the rise as a hub of tech and ICT start-ups and as an attractive target for venture capital investment in ICT and digital technology development. Many of the companies that are considered to be leading this field are in the region[22] For example, see https://www.softwaredevelopmentcompany.co/software-development-companies-eastern-europe/.
, as, too, are the majority of the countries with the fastest growth in the number of professional software developers (Figure 6). Coders from Eastern Europe have won 10 of the 17 annual Google Code Jam programming competitions since 2003[23] For a full list see https://codingcompetitions.withgoogle.com/codejam/archive
, and over just few years, venture capital investment in that sector in the region has grown from USD 10 million to USD 283 million (KPMG & CB Insights, 2016). Eastern Europe currently has some 30 000 start-ups competing in the booming ICT market[24] For more information see https://venturebeat.com/2017/01/21/a-quick-tour-of-eastern-europes-startup-hubs/
.
Figure 6. Growth in the number of professional developers (2018 versus 2017), top 10 fastest-growing countries and Moldova (%)

Note: The figure shows the 10 smaller countries in the list of 20, with a year-on-year change of less than 100 000 developers. Data for Moldova is based on estimates.
Source: Atomico (2018) and calculations based on data provided in NRF B.1.4.
Moldova still falls short of being listed in the top ten countries in terms of availability and growth of ICT skills (see, for instance, Figure 6). Nevertheless, the country is already seen as the next key destination for digital outsourcing: Moldova can offer some 2 500 information technology (IT) graduates per year, 23 000 active ICT professionals, a high rate of high-speed internet penetration, and an IT market growth rate of close to 7%[25] See, for example, https://www.indrivo.com/latest-thinking/discover-moldova-and-see-why-country-becoming-new-it-outsourcing-destination.
.
Moreover, the national report describes Moldova as a country with optimal electronic communications infrastructure and a favourable ICT business environment. The report also confirms that the ICT sector is rapidly gaining significance for the national economy and its competitiveness because of the value and jobs it creates, and because it is a magnet for foreign investment. The sector has been growing steadily year on year and in 2016 its expansion accounted for over 7% of annual GDP growth[26] Strategy for the Development of Information Technology Industry and the Ecosystem for Digital Innovation for 2018–2023, Government Decision No. 904/2018.
.
According to the recently adopted ICT strategy of Moldova, human capital is at the core of the thriving domestic ICT sector, but there are also a range of significant problems with the availability and quality of specialists needed to sustain its strategically and economically important expansion. Although the system of formal education and training produces over 800 graduates annually in the ICT field, only a fraction of these have the necessary qualifications. Year after year, the 750 ICT companies in the country report a total shortage of around 1 000 specialists[27] NRF B.1.4.
. The human capital shortages also hamper the capacity of Moldova to launch new ICT start-ups. The reasons for the bottleneck are manifold and include emigration (see also Chapter 3.1), a lack of investment in the training of ICT specialists, and the limited digital competence of the teaching workforce[28] NRF D.2.4 and D.2.5.
.
The authorities have committed to solving the problem by promoting IT as a career choice, providing lifelong learning opportunities for IT specialists and investing in the physical infrastructure of the education system on the basis of ICT innovation[29] NRF D.2.3.
. Like other strategic initiatives in Moldova that have been launched in support of HCD, those targeting the ICT sector have been implemented only recently (2018) and it is too early to judge their impact and effectiveness.