Infographics
2 items
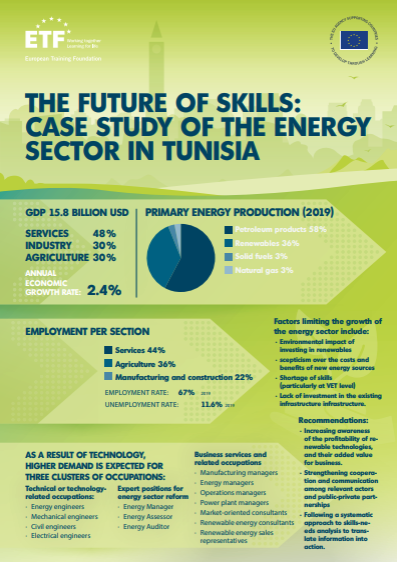
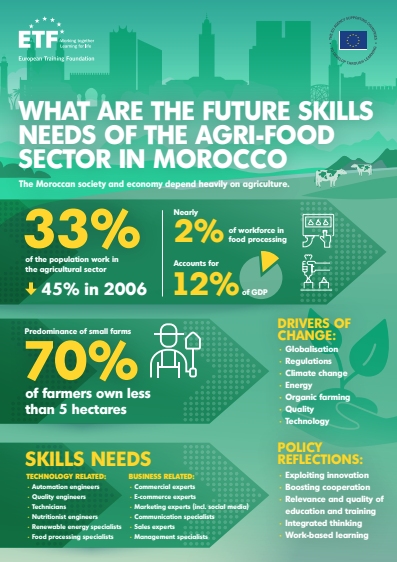
Data can tell powerful stories when it’s presented in the right way. These infographics translate evidence and analysis into clear visuals, making it easier to explore how skills, education and labour markets are evolving. Take a moment to explore the key messages and discover what the data reveals.